Trading Volume on The Egyptian Stock Market During the Year 2016
EGP | |||
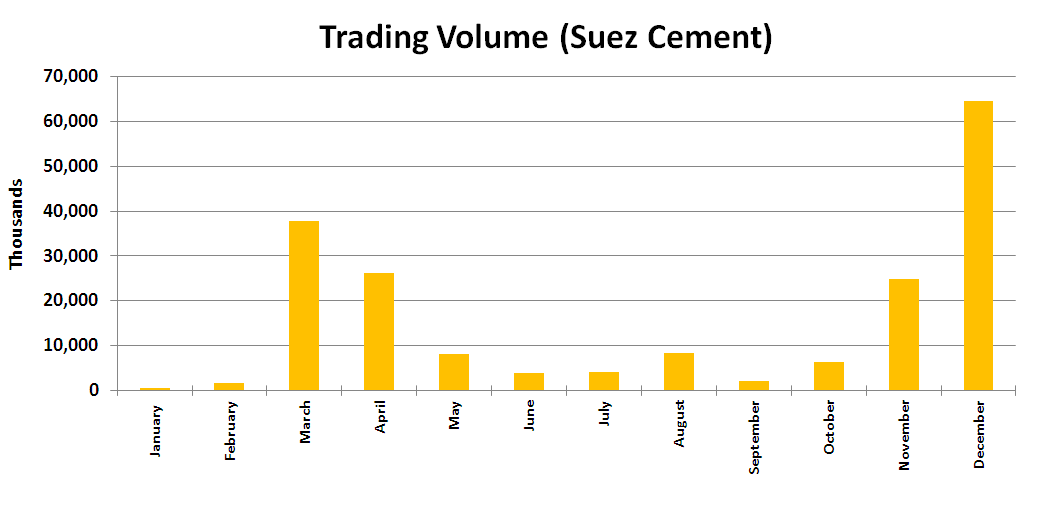
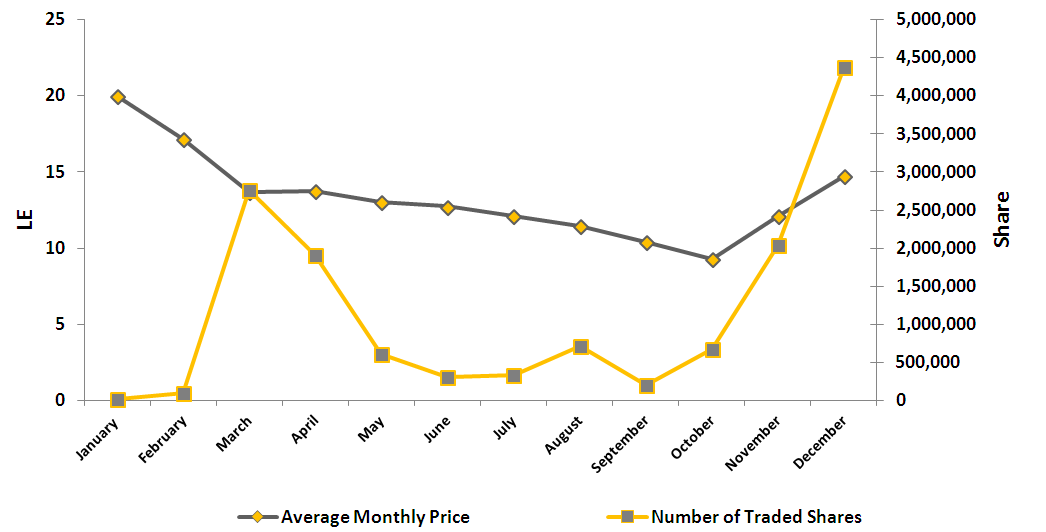
Month | Number of Traded Shares | Average Monthly Price | Trade Value |
| January | 23,616 | 20.00 | 472,389 |
| February | 96,365 | 17.17 | 1,654,934 |
| March | 2,759,537 | 13.67 | 37,733,040 |
| April | 1,909,107 | 13.74 | 26,240,302 |
| May | 614,769 | 13.05 | 8,020,137 |
| June | 310,755 | 12.75 | 3,961,444 |
| July | 342,107 | 12.13 | 4,148,449 |
| August | 721,560 | 11.49 | 8,288,490 |
| September | 204,043 | 10.41 | 2,125,096 |
| October | 675,763 | 9.31 | 6,290,701 |
| November | 2,044,133 | 12.10 | 24,736,261 |
| December | 4,379,148 | 14.75 | 64,581,211 |
Total | 14,080,903 | 13.37 | 188,252,453 |
Trading Volume (Suez Cement)
Suez Cement |
Suez Cement Performance - year 2016
Suez Cement |