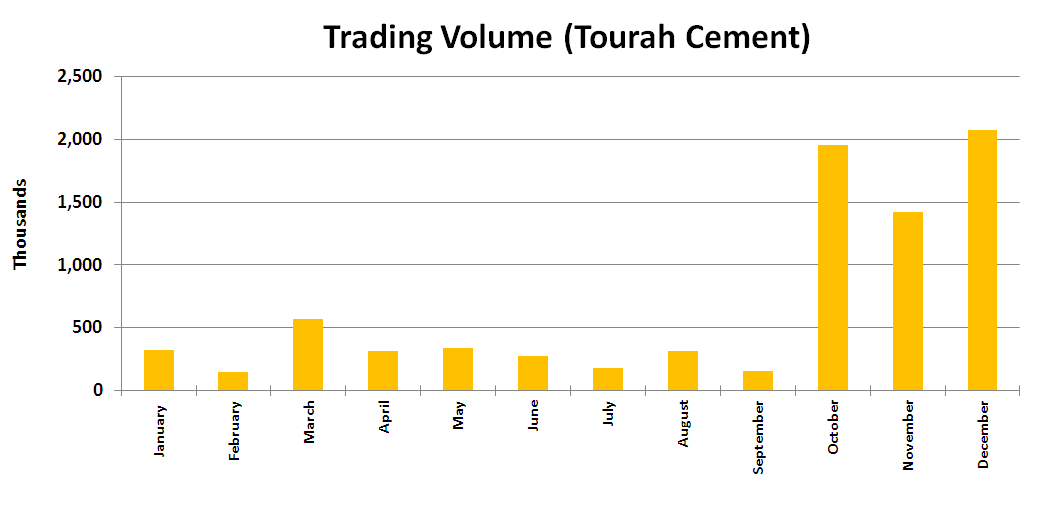
Trading Volume on The Egyptian Stock Market During the Year 2016
EGP | |||
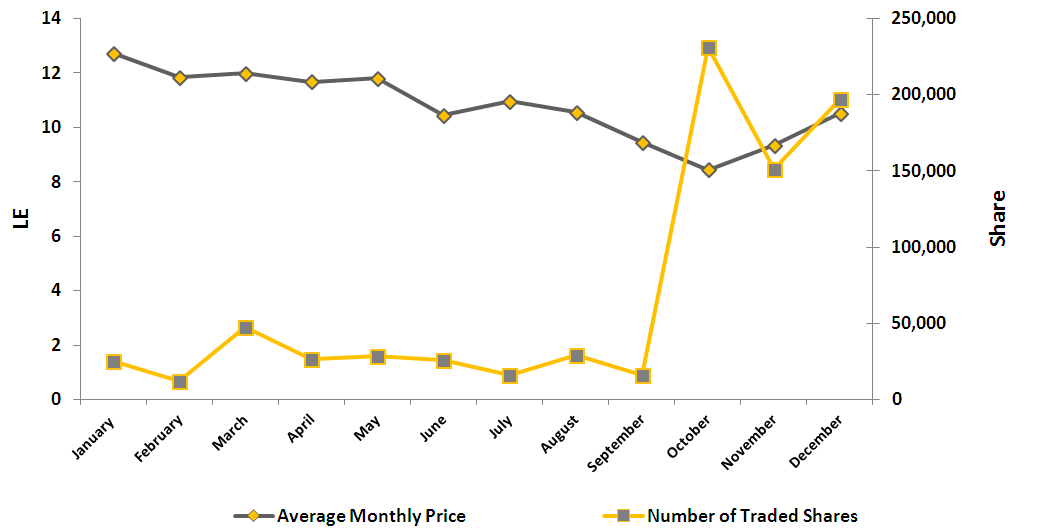
Month | Number of Traded Shares | Average Monthly Price | Trade Value |
| January | 25,427 | 12.73 | 323,661 |
| February | 12,162 | 11.84 | 144,022 |
| March | 47,715 | 11.99 | 572,023 |
| April | 26,556 | 11.68 | 310,264 |
| May | 28,628 | 11.82 | 338,399 |
| June | 25,819 | 10.44 | 269,675 |
| July | 16,374 | 10.97 | 179,572 |
| August | 29,304 | 10.56 | 309,361 |
| September | 16,265 | 9.47 | 154,107 |
| October | 231,265 | 8.45 | 1,954,414 |
| November | 151,544 | 9.35 | 1,417,084 |
| December | 197,183 | 10.51 | 2,072,977 |
Total | 808,242 | 9.95 | 8,045,559 |
Trading Volume (Tourah Cement)
Suez Cement |
Tourah Cement performance - year 2016
Suez Cement |