Trading Volume on The Egyptian Stock Market During The Year 2016
EGP | |||
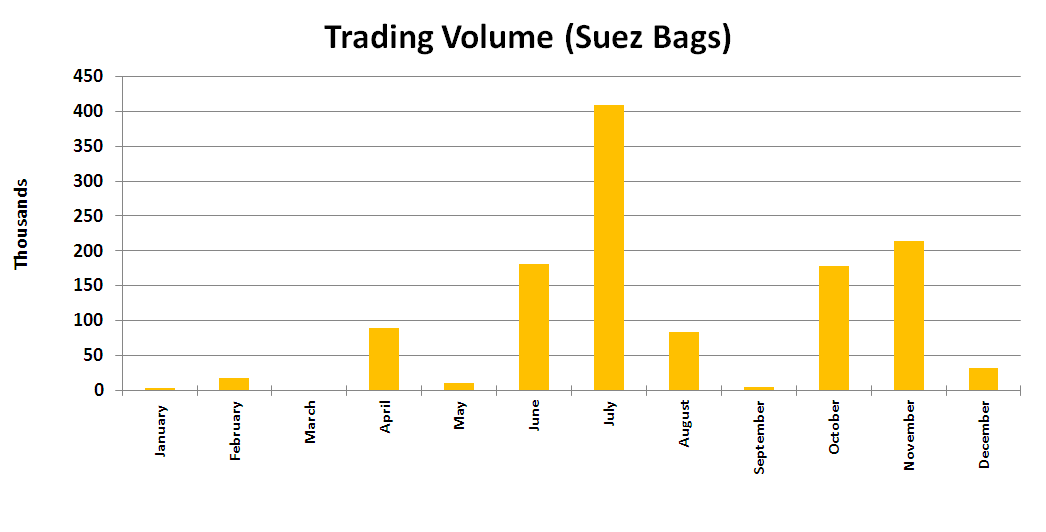
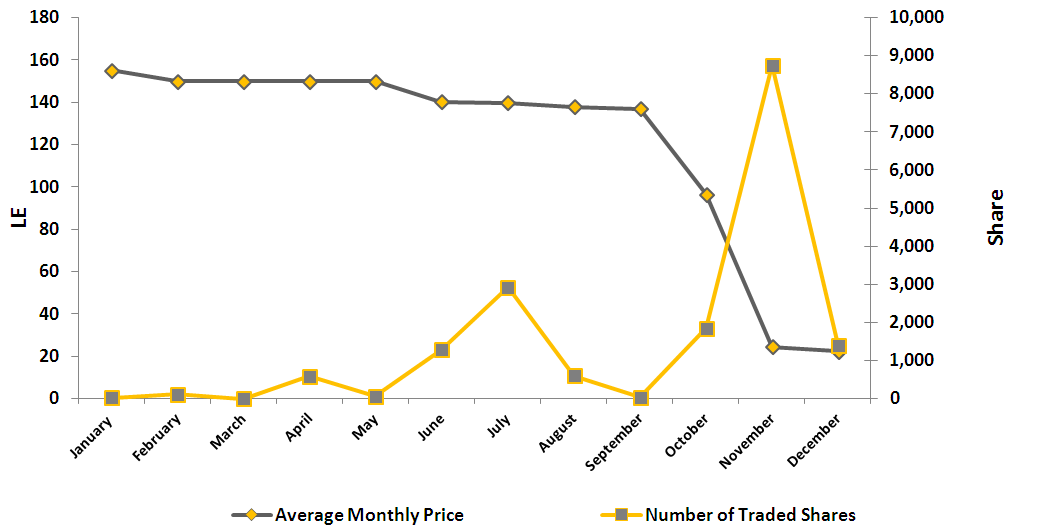
Month | Number of Traded Shares | Average Monthly Price | Trade Value |
| January | 25 | 155.00 | 3,875 |
| February | 121 | 150.00 | 18,150 |
| March | 0 | 150.00 | 0 |
| April | 600 | 150.01 | 90,006 |
| May | 66 | 150.02 | 9,901 |
| June | 1,289 | 140.22 | 180,740 |
| July | 2,928 | 139.69 | 409,022 |
| August | 603 | 137.79 | 83,089 |
| September | 37 | 137.00 | 5,069 |
| October | 1,849 | 96.56 | 178,531 |
| November | 8,749 | 24.48 | 214,140 |
| December | 1,410 | 22.41 | 31,591 |
Total | 17,677 | 69.25 | 1,224,115 |
Trading Volume (Suez Bags)
Suez Cement |
Suez Bags Performance 2016
Suez Cement |